Stem and leaf plots are a great way to get a quick visual understanding of how your data is distributed. They are especially useful for small to medium datasets. In this tutorial, we’ll walk through the steps of creating a STEM and Leaf plot.
What is a STEM and Leaf Plot?
A STEM and Leaf plot is a way of organizing a set of numbers to show their frequency distribution. The “stem” represents the leading digits of the numbers, and the “leaf” represents the trailing digits.
Step 1: Organize Your Data Start by arranging your data in ascending order. This step makes it easier to create the STEM and Leaf plot.
Step 2: Determine the Stems Identify the leading digits of each number in your data set. These leading digits will form the stems of your plot.
Step 3: Determine the Leaves For each stem, list the trailing digits of the corresponding numbers as leaves. Arrange the leaves in ascending order next to their respective stems.
Step 4: Create the Plot Draw a vertical line on your paper to represent the “stem.” Then, write the stems next to this line in ascending order. For each stem, write the leaves horizontally next to it.
Step 5: Interpret the Plot Once your STEM and Leaf plot is complete, you can easily interpret the data. Look at the distribution of the leaves for each stem to understand how the data is spread out.
Example: Let’s say we have the following data set: 12, 15, 16, 20, 22, 24, 25, 26, 28, 30.
- Organize the data: 12, 15, 16, 20, 22, 24, 25, 26, 28, 30.
- Determine the stems: The leading digits are 1, 2, and 3.
- Determine the leaves:
- Stem 1: 2, 5, 6, 6, 8
- Stem 2: 0, 2, 4, 5, 6, 8
- Stem 3: 0
- Create the plot:
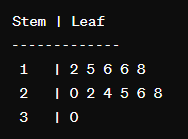
5. Interpretation: The data is spread out from the low teens to the high twenties, with a concentration around the mid-twenties.
Conclusion: STEM and Leaf plots provide a quick and easy way to visualize the distribution of numerical data. By following the steps outlined in this tutorial, you can create your own STEM and Leaf plot and gain insights into your data set.