The DIKW Pyramid, also known as the Data, Information, Knowledge, Wisdom Pyramid, can be visualized as a multi-layered structure, each representing a different stage in the transformation of data into wisdom.
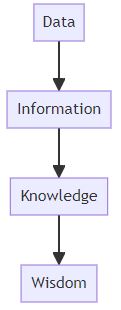
Base Layer – Data:
Imagine the lowest level of the pyramid. This is the broadest and most fundamental layer. Picture it filled with raw data – numbers, facts, and figures, without context. These are like the individual bricks of the pyramid, unprocessed and unanalyzed. In your mind, see this layer as filled with bits and bytes, perhaps even visualized as binary code or simple, unconnected dots.
Questions to Ask Yourself about Data Layer:
- How do you ensure the quality and reliability of data sources in your projects?
- Describe your approach to data storage and organization. How do you make data retrievable and interpretable for future use?
- Discuss a time when you had to deal with a large amount of unstructured data. What tools and techniques did you use to process it?
Second Layer – Information:
As you move up to the next layer, envision data beginning to take on meaning. This is the information level. Here, data is processed, organized, or structured in some way. Imagine charts, graphs, and tables here, representing data being interpreted and gaining relevance. Connections between data points start to form, creating a network of information.
Questions to Ask Yourself about Information Layer:
- How do you go about cleaning and preprocessing data? Can you describe a particularly challenging dataset you worked on?
- Explain how you identify relevant features and signals in your data. What methods do you use for feature extraction and selection?
- Describe a project where data visualization played a key role in understanding the data. What insights were you able to gain through visualization?
Third Layer – Knowledge:
Ascending further, you reach the knowledge layer. Here, information is synthesized into comprehensive insights. Picture this layer as a more complex structure, where information is not just connected but also contextualized and understood. Think of diagrams or models that represent systems or theories, indicating a deeper level of comprehension and application.
Questions to Ask Yourself about Knowledge Layer:
- How do you apply statistical or machine learning models to uncover patterns in data? Give an example of how this led to actionable insights in a project.
- Can you discuss an instance where you had to revise your initial hypothesis based on the data analysis? What did the data tell you?
- Describe a complex problem where you used predictive analytics to guide decision-making. What was the outcome?
Apex Layer – Wisdom:
Finally, at the top of the pyramid, is wisdom. This is the pinnacle, where knowledge is further refined. Envision this as a space where insights and deep understanding are applied to make informed decisions or to foster innovation. Wisdom is less about the visible structures and more about the principles, values, and ethical considerations derived from the knowledge.
Questions to Ask Yourself about Wisdom Layer:
- How do you ensure that the insights from data analysis are actionable and aligned with business objectives?
- Discuss how you communicate findings and recommendations to stakeholders. How do you ensure that your message is understood and acted upon?
- Provide an example of a strategic decision that was influenced by your data analysis. How did it impact the organization or project?
- Explain how you balance data-driven insights with intuition and experience in your decision-making process.
- How do you stay abreast of new data analysis techniques and technologies? Discuss how continuous learning has impacted your approach to transforming data into wisdom.
Open Datasets Availability in Australia:
Australian federal, state and local government agencies collect and publish anonymised public data centrally over here. The University of Technology Sydney (UTS) also does the same over here. Click here to see datasets published by Australian Bureau of Statistics.
In order to develop machine learning model, use 2/3 of the data as training dataset and 1/3 as validation dataset. Click here to see our premium quality lessons or tutorials.
Regression Analysis: Linear Regression, Logistical Regression
Classification: Classes
Some Tips: Under development
Strategies for handling missing or corrupted data in a dataset
Different strategies, such as imputation, deletion, or anomaly detection, are chosen based on the nature of the data and the specific problem at hand, allowing for a tailored approach that maximizes data utility.
Features Selection Techniques
Involves selecting the most relevant features to use in model construction, improving model performance and reducing overfitting.
- Filter Methods: Use statistical tests to select features based on their relationship with the target variable. Simple and fast, e.g., correlation coefficient scores, Chi-squared tests.
- Wrapper Methods: Evaluate subsets of features, determining their effectiveness by training a model. More computationally intensive but can lead to better performance, e.g., Recursive Feature Elimination.
- Embedded Methods: Perform feature selection as part of the model training process, combining the qualities of filter and wrapper methods. Examples include LASSO (L1 regularization) which can zero out coefficients for less important features
Features Scaling Techniques
Aims to normalize or standardize the range of independent variables or features to ensure that no variable dominates due to its scale.
- Normalization (Min-Max Scaling): Scales features to a range between 0 and 1. Useful when algorithms are sensitive to the scale of data, such as neural networks and k-nearest neighbors.
- Standardization (Z-score Normalization): Rescales data to have a mean (μ) of 0 and standard deviation (σ) of 1. It’s beneficial for models that assume the input features are normally distributed, e.g., Support Vector Machines.
Generative Adversarial Networks (GANs) in data science projects
Under development….
Bagging, Boosting and Stacking in Ensemble Methods.
Bagging, short for Bootstrap Aggregating, is a technique designed to improve the stability and accuracy of machine learning algorithms by combining multiple models trained on different subsets of the same data set. Each model runs independently, and their results are aggregated, typically by voting for classification or averaging for regression. A classic example of a Bagging implementation is the Random Forest algorithm, which combines multiple decision trees to reduce variance without substantially increasing bias. In projects where I’ve applied Random Forests, we’ve seen marked improvements in prediction accuracy for complex problems, demonstrating Bagging’s power in mitigating overfitting while maintaining model performance.
Boosting, in contrast to Bagging, focuses on sequentially improving the prediction accuracy by emphasizing the instances that previous models misclassified. It works by training a series of models, each correcting its predecessor, to create a final model with significantly reduced bias and variance. Algorithms like AdaBoost and Gradient Boosting are prominent examples where Boosting techniques shine. Our practical experience with Gradient Boosting involved optimizing hyperparameters to minimize overfitting and maximize prediction accuracy on a skewed dataset. The sequential nature of Boosting allowed us to incrementally improve our model’s performance, showcasing its effectiveness in scenarios where precision is critical.
Bagging is our go-to for reducing variance and avoiding overfitting, particularly with complex models on large datasets. Boosting, however, is invaluable for problems where bias is a concern, and improving predictive accuracy is paramount
STEM Educational Activities using Open Datasets in Australia:
Calculating Probability
Probability calculations can be applied to areas with variability or trends over time, where we want to assess the likelihood of future events based on historical data.
Examples:
- Gross Domestic Product (GDP) Growth:
- Calculate the probability of GDP growth being positive in the next quarter. This involves analyzing past GDP growth rates, identifying periods of growth (value > 0), and calculating the fraction of these periods over the total observed periods.
- Unemployment Rate:
- Determine the probability of the unemployment rate increasing or decreasing in the next period. This can be done by analyzing the month-to-month changes in the unemployment rate, calculating the number of times it has increased/decreased, and dividing by the total number of observed changes.
- Consumer Price Index (CPI) Increase:
- Calculate the probability of a CPI increase of more than 0.5% in the next quarter. This requires identifying the frequency of such increases in the past and dividing by the total number of quarters observed.
How to Implement Probability Calculations:
- Probability Calculations:
- Use Python with Pandas to load and clean the dataset.
- Identify periods/events of interest (e.g., quarters with GDP growth, months with CPI increases).
- Calculate the fraction of these events over the total number of periods observed to estimate probability.
Assessing Utility
Utility assessments can be more subjective and often involve creating a model to evaluate the benefits (or utility) of different scenarios, policies, or decisions based on the data.
Examples:
- Retail Turnover and Economic Policies:
- Assess the utility of economic stimulus measures (e.g., tax cuts, direct spending) on retail turnover. This could involve comparing changes in retail turnover following previous stimulus measures, and using this to infer the potential impact (utility) of new measures. The utility function could be constructed to value increases in retail turnover, considering both the magnitude of the increase and its sustainability over time.
- New Housing Loan Commitments and Interest Rate Decisions:
- Evaluate the utility of changes in interest rates on new housing loan commitments. A utility function here might consider the balance between stimulating the housing market (increased loan commitments) and avoiding overheating (leading to unsustainable debt levels). This could involve historical data analysis to model the relationship between interest rates, new housing loan commitments, and broader economic indicators.
How to Implement Utility Assessments:
- Define a utility function that quantifies the benefits of certain outcomes. For instance, a simple utility function for economic stimulus measures affecting retail turnover might score scenarios based on the percentage increase in turnover, weighted by the duration of the increase.
- Use historical data to evaluate how different scenarios (e.g., varying levels of stimulus) have impacted the metric of interest (e.g., retail turnover).
- Apply the utility function to these historical scenarios to assess which measures provided the highest utility, which can inform predictions or recommendations for future policies.
Feel free to contact us for designing educational activities for continuing professional development or simply delivering STEM educational lessons.